
As the world became more data-driven with an endless amount of data available to work with, the importance of data analysis is increasingly being realised, and a plethora of tools are developed to collect and analyse these massive amounts of data concerning industrial and social activities. However, the need to analyse and manage large amounts of heterogenous data remains an open challenge as new solutions are being proposed and developed for meaningful interpretations of data.
Among these new developments is the use of AI algorithms and machine learning techniques for processing large amounts of data and identifying trends, patterns, and other meaningful aspects. These aspects help businesses not only to understand the latest trends and allow them to make informed decisions, but they also allow help understand customer behaviour, develop new products, measure KPIs and performance, etc. For this reason, was developed the DryICE solution.
What is the DryICE solution?
DryICE is a data orchestration and analytic solution designed to discover and identify hidden patterns in data and manage distributed data storage. DryICE offers a range of functionalities to identify patterns in the (historic and real-time) data and a dynamic dashboard to collate and visualise the analytic outcomes; enabling users to explore these patterns as well as underlying representative data. It also works as a distributed data warehouse, generating visualisations and alerts based on the interest of the user.
The Key Benefits of DryICE include:
- Powered by (extensible) AI algorithms, it has an Autonomous and assisted knowledge discovery feature to identify hidden patterns autonomously, offering visual results based on user requirements.
- Support for multiple types of visualisations to interface with the user, allowing them to understand the patterns and provide information of interest.
- Easy integration with data-centric technologies enables it to interface with multiple heterogeneous data sources. Alerts can be set up to inform the user about timely data ingestion.
- Support for distributed data Warehouse Storage, DryICE has the ability to ingest and store the data from/to distributed locations, reducing network traffic and supporting distributed computing.
The DryICE has been developed using state-of-the-art technologies to position it among some of the best open-source data analysis too. The overview of technologies used are as below:
- Click house – Database is an open-source column-oriented DBMS (columnar database management system) for online analytical processing (OLAP) that allows users to generate analytical reports using SQL queries in real-time. This powerful database can store trillions of rows of data, with lightning-fast query throughput. Industry leader companies like Yandex, Uber, eBay, Spotify, Deutsche Bank employ Clickhouse as their primary database.
- Python is a computer programming language often used to build websites and software, automate tasks, and conduct data analysis. DryICE uses Python for internal data processing to handle various encoding processes such as CSV, XML, HTML, SQL, JSON, etc.
- Kafka is an open-source distributed event streaming platform used to maintain high-performance data pipelines, streaming analytics, data integration. DryICE uses the Kafka framework as the intermediate data channel among components.
- The superset is a fast, lightweight, and intuitive data exploration and visualisation platform with options that make it easy for users of all skill sets to explore and visualize their data. This component is used as the main tool for the DryICE dashboard and graphs.
- Vuejs – DryICE has also used Vuejs as the JavaScript framework to build user interfaces.
- js is a graphics library. DryICE uses the RoughJs library for the lines, curves, arcs, circles, and other graphic icons for data visualisation.
The DryICE in iHelp project
DryICE offers the capability to ingest data from multiple sources, store and visualise the output for decision support. The role of this tool in the iHelp project is to process the outcomes or results from the Analytics components and provide decision support to the target users by transforming the results into meaningful graphs and charts.
During the project, primary data (Retrospective and Prospective Electronic Health Records) and secondary data (mobile app and wearables i.e FitBit) will be provided by the Pilot partners and users (participants in the trials) respectively. The data will be received at the Decision Support System (DSS) component and will be used by the Analytics component (AI & Analytics) for analysis. The results of this analysis will then be forwarded to the DryICE. Using the technologies i.e., Superset, Vuejs, and Roughjs, DryICE will transform the analytic results into easily understood shapes or forms (e.g., charts and graphs) based on the requirements of different types of users e.g., clinicians, researchers, users, etc. The user-friendly representations of the analysed data will be sent back to the DSS for presentation to the user.
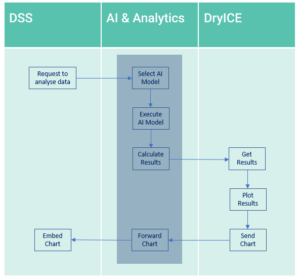
In this approach, the data analytic and visualisation aspects are distributed in the iHelp platform to support the extensibility of analytic, visualisation, and dashboard solutions. The core DryICE solution is packaged as a series of containers, making it easily deployable in the Cloud environment.
The application of DryICE in the iHelp project will be elaborated in the deliverables of WP4, namely D4.4 and D4.6, which will be made available on the project website.