What is the Analytics Workbench
The Analytics Workbench is a building block of the iHelp infrastructure which aim is to host all AI and ML models developed within the context of iHelp. Figure 1 below shows where the Analytic Workbench is placed and with which other components it communicates.
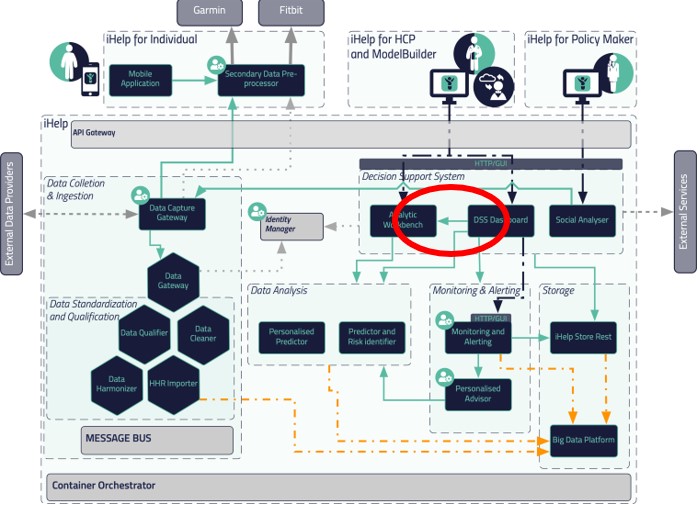
The Analytic Workbench is composed of four sub-modules and each of them oversees one activity:
1. Model Trainer. This module helps the data scientist in training their own AI/ML models following a wizard-like training.
2. Model Manager. This module allows the models created with either the Model Trainer or the Advanced Notebook can be queried for execution. In addition, it comes with an extra functionality that allows the import of 3rd party models trained with other technologies.
3. Advanced Notebook. This module helps data scientists train their own AI/ML models by using a script-based way using Jupiter Notebooks.
4. Runtime Engine. This module oversees executing the different AI/ML models hosted at the Model Manager to predict their corresponding risks.
How to use the Model Trainer of the Analytics Workbench
The Model Trainer is meant to facilitate the in-house Data Scientists from the clinician partners participating in iHelp to train their models based on the data existing from their datasets.
These Data Scientists can select between different clustering and classification algorithms to train their data. The Model Trainer uses a wizard style to guide the Data Scientists while training the models. Once the model has been trained, they can deploy this trained model to the Model Manager so it can be called by the iHelp Decision Support System (DSS).
The results of this execution will be shown in the iHelp DSS itself where the final user can make the most appropriate decision based on the results shown.
Within iHelp, these datasets must be compliant with HHR (Holistic Health Records) and FHIR (Fast Healthcare Interoperability Resource) data models; however, the Model Trainer is capable of training models on non-compliant datasets as well.
What kind of AI models have been developed
Two types of AI models, also known as predictors, have been developed under iHelp:
1. A personalized predictor, which is based on data around specific diseases and specific risks identified for individuals within the integrated (HHR) datasets. With this functionality, it has been possible to develop personalized health models that enable the identification of disease(s) and their contributing factors.
2. A predictor and risk identifier, which is based on deriving the disease- and risks-related knowledge from the integrated (HHR) data by using AI-based novel anomaly detection algorithms.
Whilst the first predictor has allowed the development of prediction mechanisms for certain risks, based on the analysis of disease-centric trends and patterns, the second one has been developed to robustly detect risks based on the analysis of a variety of (historical and real-time) data for each patient and by doing so also provide relevant predictions and assessments (correlations, trend, pattern, underlying factors, etc.) on individuals’ health status.
Furthermore, the second predictor combines facts from streaming data not necessarily related to health (e.g., lifestyle and social interactions), collective knowledge/intelligence and information related to the individual (e.g., from the health records and the stored health status monitoring data). The analysis of these combined facts provides knowledge referring to different types of risks and their evolution in time. Finally, the second predictor also enables the possibility to evaluate the impact of different symptoms, decisions, and environmental conditions regarding the same situation-dependent attributes such as lifestyle choices, mobility modes, etc.
Data Analysis
One of the AI models developed within iHelp focuses on predicting the risk of developing pancreatic cancer based on lifestyle choices. The AI model is developed using the data acquired from the Hospital de Dénia – Marina Salud (HDM) use case.
This AI model is trained on a dataset of 200 patients (provided by HDM) containing data from blood analysis and other physical tests. It also contains an extra set of parameters containing comorbidities from such patients so the training could incorporate this information making it complete and more accurate, considering historic data about alcohol, tobacco, hepatitis, hypertension, diabetes, cholesterol, obesity, pancreas, and h-pylori for each patient.
Besides adding complexity, all these comorbidities enrich the trained models and increase their rate accuracy, from an initial 70% where no comorbidities were considered to a range of 80%-85% (see Table 1 below).
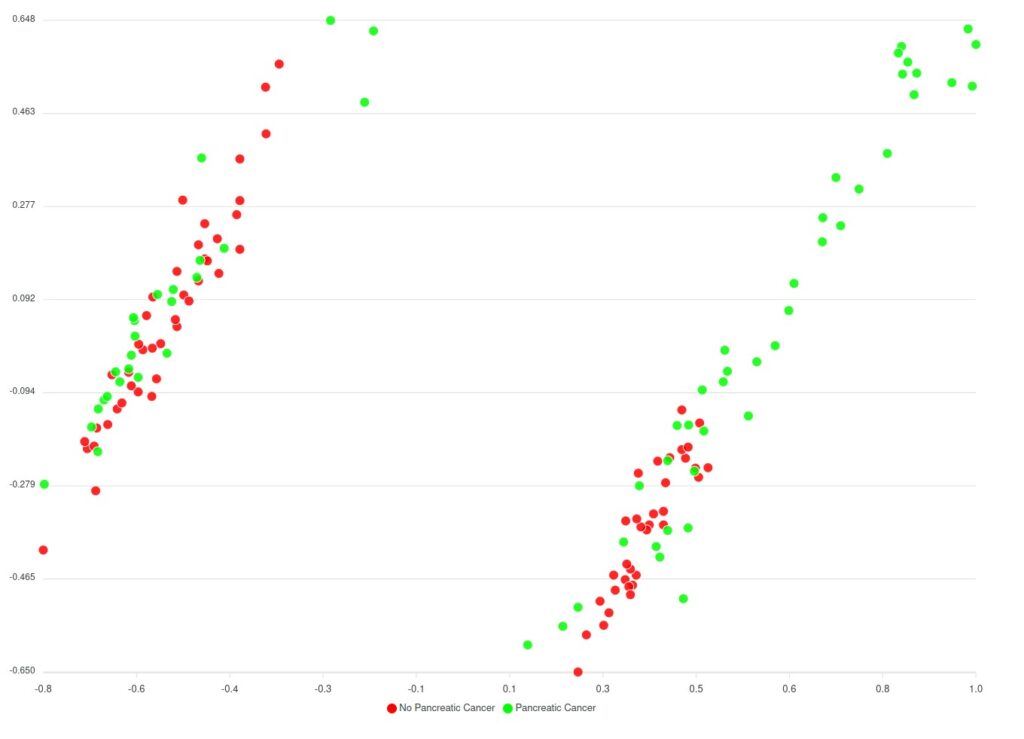
Before the comorbidities were considered, a huge number of AI models (around 240.000 models) have been trained, to assess every parameter combination requested by the classification algorithm. The best-performing model hit the 70% accuracy rate and the results are displayed in Figure 2 below.
Regarding the model considering comorbidities, a limited number of variations for the parameters have been trained and the results are still limited; however, it appears that the predicted clusters look better in comparison to the models trained without comorbidities as they have far less overlapping between the data and the clusters.
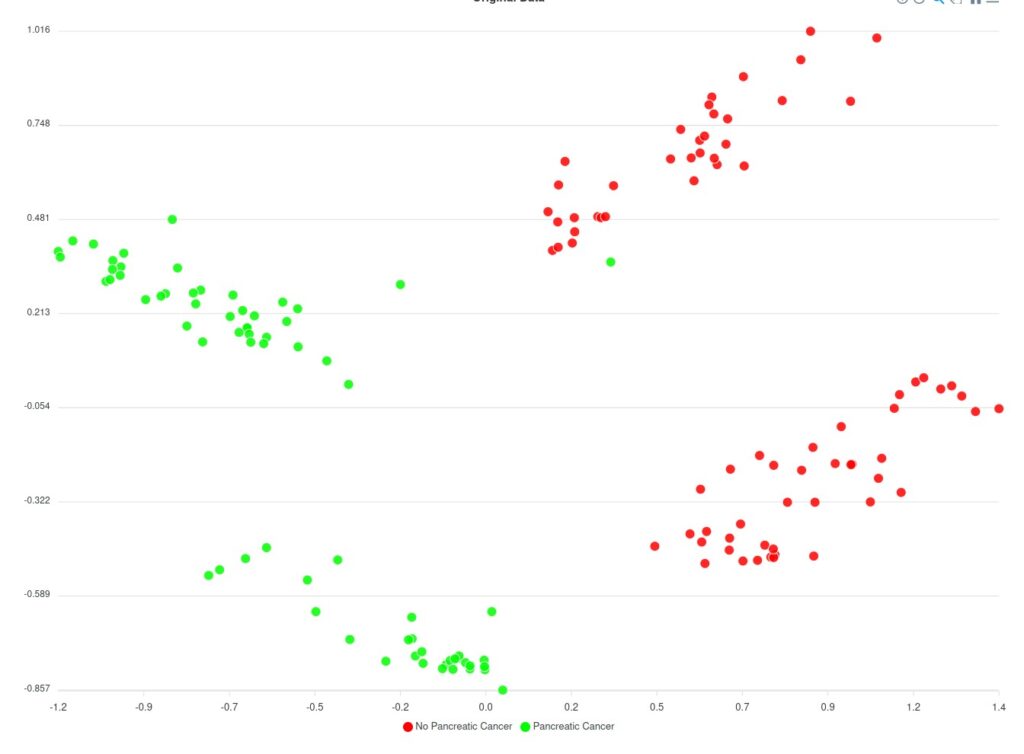
Based on Figure 2 and Figure 3 two groups of clusters can be distinguished: the Red group and the Green group. The Red group lists all patients that have not been diagnosed with pancreatic cancer whereas the Green group corresponds to those patients that have been diagnosed. Considering this classification, an initial prediction on the likeliness or risk of developing pancreatic cancer of further patients can be regarded. However, as said, this classification (of Figure 3) does not consider the comorbidities yet.
The comparison of both models is summarized in the following table:
| Silhouette coefficient | Adjust Rand Index (ARI) | Sensitivity (True Positive Rate) | Specificity (True Negative Rate) | |
| Models without considering comorbidities | 0,49 | 0,01 | 65-70% | 30-35% |
| Models considering comorbidities | 0,325 | 0,475 | 80-85% | 15-20% |
The Silhouette coefficient indicates the separation between the clusters and the coefficient should be as close as possible to 0,5 (the optimal range is between -1 and 1). The closer to 0,5 the better in the sense that the clusters will have fewer overlapping samples. On the other hand, the Adjust Rand Index (ARI) indicates the matching between real labels and the predicted clusters. Again, as the optimal range is between -1 and 1, the model considering comorbidities is closer to 0,5 meaning that it performs better in matching between real and predicted clusters.
Regarding the second predictor model, this considers the data gathered over 6 months where a subgroup of volunteers has acceded to be part of the experiment. These volunteers have been enrolled to change their daily activities and habits so that an epigenetic analysis can be performed. After a six-month period has passed, we are now in the position to assess whether these volunteers have their epigenetic markers changed in the right direction to perform the clinical study, which is the purpose of this use case. In other words, see how the changes in lifestyle and habits influence the likeliness of developing pancreatic cancer.